MySQL process running
| Metric | Comments | Suggested Alert |
|---|---|---|
| mysqld process count | Right binary daemon process running. | When process count /usr/sbin/mysqld != 1 |
System Metrics on a SQL Server
These are the top system resources to monitor on a database server. When you experience any issue or bottleneck, these are the first you need to have a look at:
| Metric | Comments | Suggested Alert |
|---|---|---|
| Load | An all-in-one performance metric.Understanding Linux Load. | When load is > factor x (number of cores). Our suggested factor is 4. |
| CPU usage | A high CPU usage is not a bad thing as long as you don’t reach the limit. | None |
| Memory usage | Ideally your entire database should be stored in memory, but this is not always possible. Give MySQL as much as you can afford but leave enough for other processes to function. | None |
| Swap usage | Swap is for emergencies only, and it should not be used. | When used swap is > 128MB. |
| Network bandwidth | Unless doing backups or transferring huge amounts of data, it shouldn’t be the bottleneck. | None |
| Disk usage | Make sure you always have free space for new data, temporary files, snapshot or backups. | When database, logs and temp is > 85% usage. |
Disk is one of the most common bottlenecks, so it’s worth keeping an eye on some detailed metrics here. You can get those with
iostat (for more info oniostat check out Monitoring IO performance using iostat & pt-diskstats).
iostat
- By default iostat produces two reports; the CPU Utilization report
and the Device Utilization report.
- Inclusion of the CPU and Device Utilization reports can be
controlled with the -c and -d options.

The default Device Utilization report can be replaced with extended
statistics using the -x option


pt-diskstats
• pt-diskstats is part of the percona toolkit. • pt-diskstats is open source software written in Perl, and is available under the GNU General Public License, version 2.
• Other utilities in the percona toolkit include pt-stalk, pt-tablechecksum, pt-table-sync, pt-query-digest, and pt-summary.
| Metric | Comments | Suggested Alert |
|---|---|---|
| Read/Write requests | IOPS (Input/Output operations per second) | None |
| IO Queue length | Tracks how many operations are waiting for disk access. If a query hits the cache, it doesn’t create any disk operation. If a query doesn’t hit the cache (i.e. a miss), it will create multiple disk operations. | None |
| Average IO wait | Time that queue operations have to wait for disk access. | None |
| Average Read/Write time | Time it takes to finish disk access operations (latency). | None |
| Read/Write bandwidth | Data transfer from and towards your disk. | None |
MySQL Metrics
Monitoring MySQL availability and connections
Let’s start with the metrics that establish if your MySQL server is working.
| Metric | Comments | Suggested Alert |
|---|---|---|
| Uptime | Seconds since the server was started. We can use this to detect respawns. | When uptime is < 180. |
| Threads_connected | Number of clients currently connected. If none or too high, something is wrong. | None |
| Max_used_connections | Max number of connections at a time since server started. (max_used_connections / max_connections) indicates if you could run out soon of connection slots. | When connections usage is > 85%. |
| Aborted_connects | Number of failed connection attempts. When growing over a period of time either some credentials are wrong or we are being attacked. | When aborted connects/min > 3. (only on not public exposed servers, otherwise will generate noise) |
MySQL typical errors
Common failure points you need to keep an eye on.
| Metric | Comments | Suggested Alert |
|---|---|---|
| (Errors) | Are there any errors on the mysql.log file? | None |
| (Log files size) | Are all log files being rotated? | None |
| (Deleted log files) | Were any log files deleted but the file descriptor is still open? | None |
| (Backup space) | Do you have enough disk space for backups? | None |
Monitoring MySQL queries
These metrics track whether our database does what it’s meant to do. Answer queries that is (!):
| Metric | Comments | Suggested Alert |
|---|---|---|
| Questions (/s) | Number of statements sent by clients. | None |
| Queries | Number of executed statements (including stored procedures) | None |
| Read / Writes | Reads: selects \+ cache hits Writes: inserts \+ updates \+ deletes | None |
These metrics keep track of the queries that are affecting your server’s performance:
| Metric | Comments | Suggested Alert |
|---|---|---|
| Slow_queries | Number of queries that took more than long_query_time seconds to execute. Slow queries generate excessive disk reads, memory and CPU usage. Check slow_query_log to find them. | None |
| Select_full_join | Number of full joins needed to answer queries. If too high, improve your indexing or database schema. | None |
| Created_tmp_disk_tables | Number of temporary tables (typically for joins) stored on slow spinning disks, instead of faster RAM. | None |
| (Full table scans) Handler_read% | Number of times the system reads the first row of a table index. Sequential reads might indicate a faulty index. | None |
Monitoring MySQL caches, buffers, and locks
Here are some key metrics for optimizing caches and buffers, whilst detecting any locked transactions. We would love to hear about your suggested metrics as well.
| Metric | Comments | Suggested Alert |
|---|---|---|
| Innodb_row_lock_waits | Number of times InnoDB had to wait before locking a row. | None |
| Innodb_buffer_pool_wait_free | Number of times InnoDB had to wait for memory pages to be flushed. If too high, innodb_buffer_pool_size is too small for current write load. | None |
| Open_tables | Number of tables currently open. If this is low and table_cache is high, we can reduce cache size. If opposite, we should increase it. If you increase table_cache you might have to increase available file descriptors for the mysql user. | None |
| (Long running transactions) | Tracks whether too many transactions are locked by other idle transactions, or because of a problem in InnoDB. | None |
| (Deadlocks) | Deadlocks happen when 2 transactions mutually hold. These are unavoidable in InnoDB and apps should deal with them. | None |
MySQL Monitoring Methods and Tools
There are plenty of contenders out there. Below are the most popular ones:
MySQL queries / mysqladmin
Connecting to your MySQL server and running a few queries will allow you to retrieve many metrics. For example:
$ mysql -u root -p
SHOW GLOBAL STATUS;
[...]
SHOW GLOBAL STATUS LIKE 'aborted_connects';
[...]
SHOW PROCESSLIST;
[...]
As a simpler alternative, you can use mysqladmin, which should be included in your MySQL server packages:
$ mysqladmin -u root -p extended-status processlist
These options are great when you just need to check a metric value and you don’t want to bother with additional software.
When it comes to more advanced monitoring, however, our humble “poor man’s scripts” won’t cut it. So let’s take a look at some tools and solutions the MySQL community has come up with.
MyTOP / Mtop / Innotop
MyTop displays statistics about threads, queries, slow queries, uptime, and load in a top-like interface. You can find
mytop in Debian/Ubuntu/CentOS repositories. Here is a great tutorial by the folks at DigitalOcean.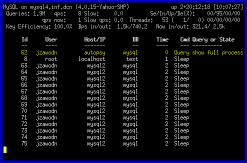
Percona Monitoring Plugins
mysqladmin and innotop are great interactive / realtime tools. But when managing a MySQL server you will often need to record metrics. That helps with troubleshooting, alerting, and analysis.
Percona Monitoring Plugins is the most popular open source solution for that. It provides graphing and alerting on top of existing on-premise monitoring solutions like Nagios, Cacti or Zabbix. Some of these plugins make use of thePercona Toolkit, a popular toolkit for database administrators developed by Percona (previously known as Maatkit).
List of Plugins
- Alert when LVM snapshots are running out of copy-on-write space.
- pmp-check-mysql-deadlocks
- pmp-check-mysql-deleted-files
- pmp-check-mysql-file-privs
- pmp-check-mysql-innodb
waiter_count
Alerts if too many transactions are in LOCK WAIT status. Uses information from SHOW ENGINE INNODB STATUS if the INFORMATION_SCHEMA tables are not available. The default critical level is 25, and warning is 10.
max_duration
Alert when MySQL replication becomes delayed.Alerts if any transaction is too old. Uses information from SHOW ENGINE INNODB STATUS if the INFORMATION_SCHEMA tables are not available. The default critical level is 600, and warning is 60.
This Nagios plugin examines whether MySQL replication is delayed too much. By default it uses SHOW SLAVE STATUS, but the output of the Seconds_behind_master column from this command is unreliable, so it is better to use pt-heartbeat from Percona Toolkit instead.
Check MySQL SHOW GLOBAL STATUS output.
MySQL Performance schema
If you want to further your understanding of MySQL server performance, then give MySQL Performance Schema a try. A good starting point is What is the MySQL Performance Schema and Why is It Needed. Read together with theMySQL sys schema documentation.
Until MySQL 5.5 the tools available to investigate what is going on inside MySQL were somewhat limited. Some of the tools were:
- The slow and general query logs
- The status counters available through SHOW [SESSION|GLOBAL] STATUS
- Storage engine status, e.g. SHOW ENGINE INNODB STATUS
- The EXPLAIN command to investigate the query plan of a SELECT statement
- SHOW PROFILE to profile one or more queries
- The MySQL error log
- The Performance Schema data is available through the PERFORMANCE SCHEMA storage engine in the performance_schema database, so it is possible to query the data using standard SQL statements.
- The Performance Schema is available irrespectively of the platform, so while the exact data collected will differ between platforms, the way it works from a DBAs perspective it is the same. This for example means it is possible to create tools that can work across all the MySQL instances. A great example of this is the ps_helper collection of views and stored procedures written by Mark Leith.
- It is possible to configure the Performance Schema dynamically as long as the plugin has been enabled (this is the defaults as of MySQL 5.6.6).
- It is easy to add new instrumentation points including adding instrumentation to third party plugins.
- Enabling the Performance Schema is transparent to normal operations (although obviously there will be a small performance impact – MySQL 5.6 is much better in this respect than MySQL 5.5 though).
MySQL 5.6 includes some new features in the performance schema, specifically for collecting query performance data.
The Idea
•Executing
a query is broken down to hundreds of smaller tasks
•There
are background tasks as well
•We
want to instrument it all to know where server is spending time
Implementation
•Instrumentation:
measuring when event begins
and
ends
•Implemented
in MySQL code on server end
storage
engine level
•Can
be enabled/disabled or customized
Schema and a
Storage Engine
12
+----------------------------------------------+
|
Tables_in_performance_schema
|
+----------------------------------------------+
|
cond_instances
|
|
events_waits_current |
|
events_waits_history
|
|
events_waits_history_long
|
|
events_waits_summary_by_instance
|
|
events_waits_summary_by_thread_by_event_name |
|
events_waits_summary_global_by_event_name
|
|
file_instances
|
|
file_summary_by_event_name
|
|
file_summary_by_instance
|
|
mutex_instances
|
|
performance_timers
|
|
rwlock_instances
|
|
setup_consumers
|
|
setup_instruments
|
|
setup_timers
|
|
threads
|
+----------------------------------------------+
What are top wait
events in my server?
SELECT
COUNT_STAR, SUM_TIMER_WAIT, AVG_TIMER_WAIT
FROM
events_waits_summary_global_by_event_name
ORDER
BY SUM_TIMER_WAIT DESC LIMIT 10;
innodb_buffer_pool_instance=10
SELECT
* FROM
events_waits_summary_global_by_event_name
ORDER
BY SUM_TIMER_WAIT DESC LIMIT 10;
Which files are
being accessed the most?
mysql>
SELECT SUM_NUMBER_OF_BYTES_READ, SUM_NUMBER_OF_BYTES_WRITE
FROM
file_summary_by_instance
ORDER
BY SUM_NUMBER_OF_BYTES_READ+SUM_NUMBER_OF_BYTES_WRITE DESC LIMIT 10;

댓글 없음:
댓글 쓰기